

.jpg "Brad Loeb")
Agency Ownership | Business Advice | Logistics | Transportation | Best Practices | Freight Management | Shippers | Recruiting | Freight Broker
Check back in with us monthly to stay up to speed on freight market conditions. Our snapshots compile market data from public sources to help you stay informed.
This edition looks at factors contributing to record freight rates, the impact of unprecedented port congestion, and a continued driver shortage.
And mark your calendars for International Road Safety Check taking place May 4-6, 2021. That's a month earlier than usual! The focus this year will be on hours of service and lighting.
Never a Dull Moment
In the second quarter of 2021, volatility is still the name of the game in freight markets. Volumes have dropped for the first time in weeks, and truck postings have increased. But rates continue to hold at record levels, which shows how tight the market truly is. Carriers also still hold sway with pricing power.
Year-over-year (YoY) load postings are up over 700% on DAT across Van, Reefer, and Flatbed, while Reefer YoY posts are up almost 1000% when looked at alone.
Keeping track of all of the moving parts and pieces can be challenging. Here are a few highlights to keep in mind this month:
Port Congestion Continues
The Port of Long Beach broke a 110-year record in March for the number of containers moved. March is usually the slowest month for ocean shipping. The number of vessels at the Port of Long Beach is currently 28, down from 40 in January. In contrast, zero anchored ships are waiting in New York. Notably, New York typically processes smaller ships than Los Angeles and has invested heavily in infrastructure to help handle more significant volumes.
Total container volumes are up 57% YoY nationally, 70% YoY for the west coast, and 40% for the east coast. Companies continue to rebuild inventories after pandemic-related depletions in 2020, impacting total volume. However, congestion among land operations (container turn times, chassis, and warehouses) combined with pandemic operations and social distancing contributes to the backups we're seeing. It's unlikely that container volumes will drop until the end of Summer, at the earliest.
Intermodal Capacity
Intermodal capacity remains tight due to elevated shipping demand off the west coast and the network disruptions that the February polar vortex caused.
Van, Reefer, and Flatbed Capacity & Rates
Produce season is beginning across the United States, with Florida, southern Georgia, Texas, and California all seeing higher demand for Reefer capacity. Dry Van and Reefer spot rates remain flat on a national average. Van rates are up $0.82 YoY and $0.49 compared to this time in 2018. Reefer rates are up $0.84 YoY and $0.54 compared to this time in 2018.
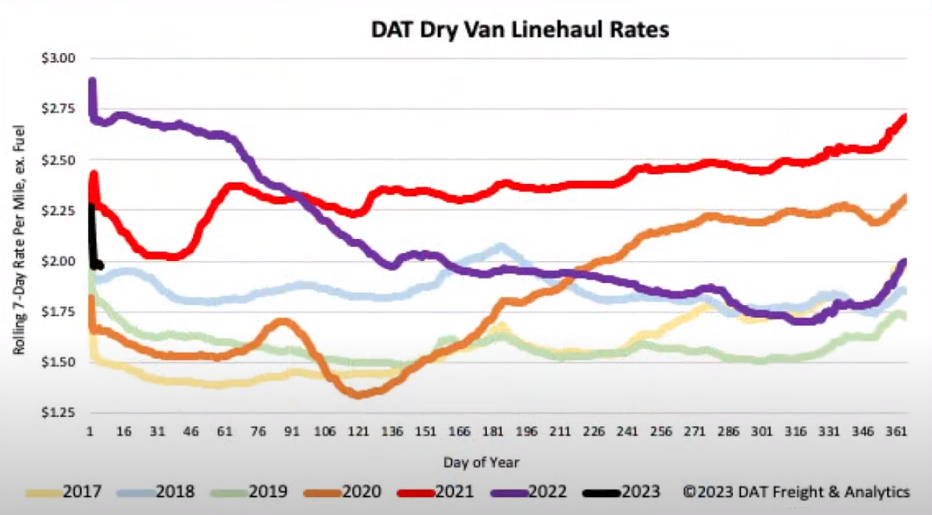
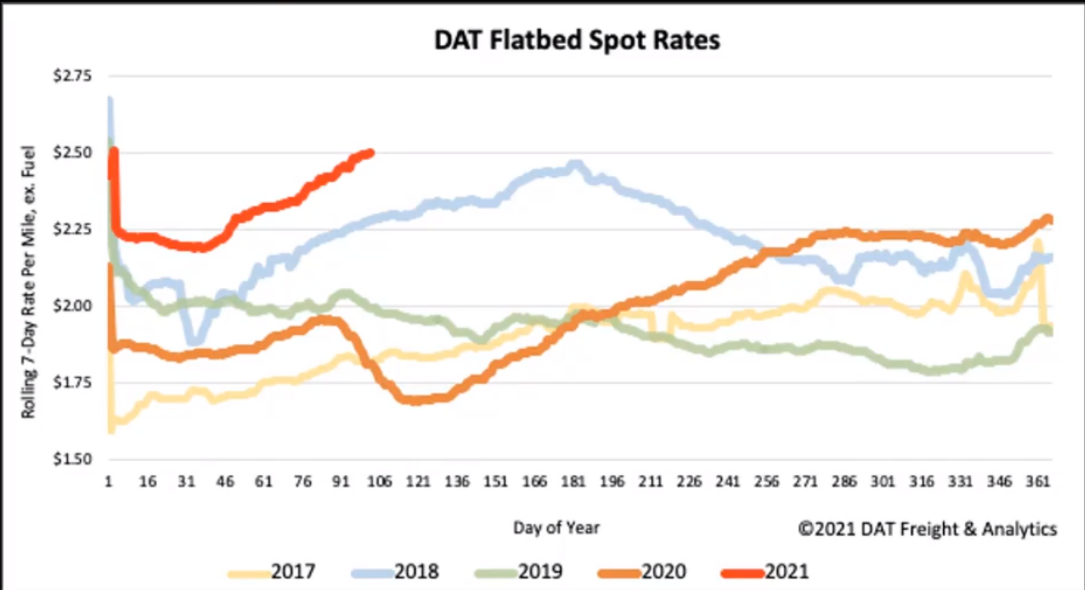
Flatbed rates continue to rise with flatbed rates higher than contract for the first time since June 2018. Rates have increased every week since February. Flatbed rates are up $0.78 YoY and $0.23 compared to this time in 2018.
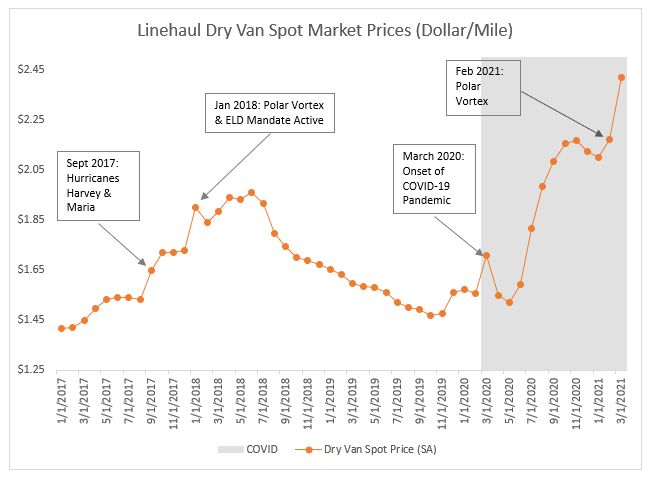
What's driving the rate increase?
In a typical market, historically speaking, the average split between contracted versus spot freight is around 85% contracted and 15% spot. After the initial crash caused by the pandemic, spot volumes jumped by almost 100% and became about 25% of the market by the end of 2020.
Carriers were unable to support their regular lanes because of a decrease or abundance of contracted freight. Drivers were also forced out of route and unable to reposition to cover their contracted freight. With fewer drivers able to cover contracted freight, rejection levels hit a record high of around 50%. This caused a massive influx of freight into the spot market, driving rates up.
A continued – and even increased – driver shortage is also responsible for driving up rates. The pandemic forced restrictions on driver schools, significantly impacting the ability to train and add new drivers. A stronger job market creates opportunities for drivers in other industries with positions closer to home. The Drug and Alcohol Clearing House is keeping about 50,000 drivers from returning to work. Finally, the driver pool of available talent is shrinking with fewer people showing interest in driving over-the-road truck routes.
Some Good News
New truck orders are up 400% YoY. With rates increasing and trucking companies seeing more freight than ever, new truck orders are back in full swing. Unfortunately, it will be some time before those new trucks arrive because of the shortage in the semi-conductor industry for chips. We expect this delay to extend into 2022.
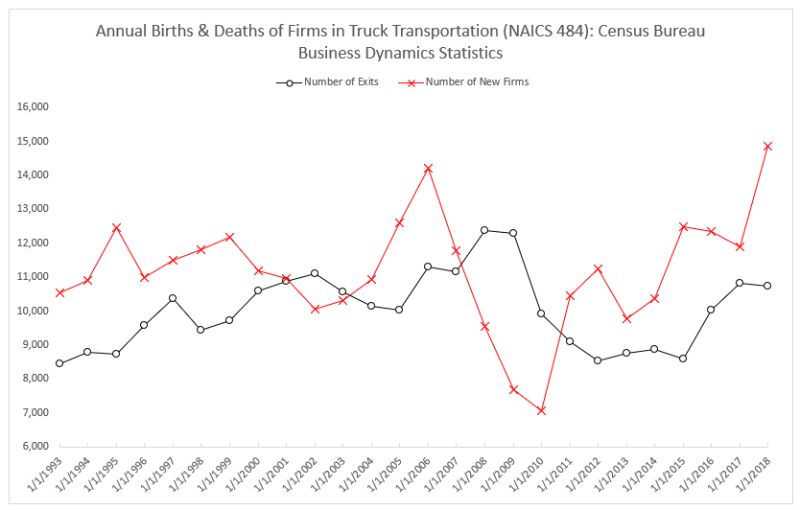 Graph provided by Jason Miller from MSU
Spread the Word
Do you know someone in the industry who could benefit from a snapshot and analysis of the market today? Share this post or comment below - we welcome feedback from our community!
Subscribe to our blog today and get these updates in your inbox!